In their very well known article "The Cult of Statistical Significance", Ziliak and McCloskey write:
"William Sealy Gosset (1876-1962) aka “Student,” working as Head Experimental Brewer at Guinness’s Brewery, took an economic approach to the logic of uncertainty. Fisher erased the consciously economic element, Gosset's "real error." We want to bring it back….Statistical significance should be a tiny part of an inquiry concerned with the size and importance of relationships."
For those unfamiliar with the history of statistics, Gosset was the one that came up with the well known t-test so many of us run across in any basic statistics class. A lot of issues are addressed in this paper, but to me one related theme is the importance of 'practical' or what I might call 'actionable' statistics. And context matters. Are the results relevant for practical consideration? Is the context realistic? Are there proper controls? What about identification? For instance, not long ago I wrote about a study that attempted to correlate distance from a farm field and exposure to pesticides and autism that has been criticized for a number of these things, even though the results were found to be statistically significant. As well as this one attempting to claim that proteins from Bt (read "gmo") corn were found in the blood of pregnant women. And...not to forget, the famous Serelini study that claimed to connect roundup herbicide to cancer in rats, that was so bad that it was retracted. Context, and economics (how people behave in the context of real world decision making scenarios) really matter. Take for instance, California's potential consideration to put roundup on a list of known carcinogens that might actually cause environmental harms in a number of ways magnitudes worse than roundup itself ever could.
So what does this all have to do with bacon? Well recently you might have heard a headline like this: “Processed meats rank alongside smoking as cancer causes – WHO.”
This is a prime example of the importance of putting science and statistical significance, effect sizes, context (like baseline risks in the case of WHO quote above) and practical significance into perspective. Millions of people have heard this headline, taken the science at face value, and either acted on it or given it way more credence and lip service than it deserves. At a minimum every time for the rest of their life they have a piece of bacon they might think, wow, this could be almost as bad or worse than smoking.
Economist Jayson Lusk has a really nice post related to this with several quotes from a number of places, and I'm going to borrow a few here. From an article he links to in the Atlantic:
"the practice of lumping risk factors into categories without accompanying description—or, preferably, visualization—of their respective risks practically invites people to view them as like-for-like. And that inevitably led to misleading headlines like this one in the Guardian: “Processed meats rank alongside smoking as cancer causes – WHO.”
“One thing rarely communicated in these sorts of reports is the baseline level of risk. Let's use Johnson's example and suppose that eating three pieces of bacon everyday causes cancer risk to increases 18%. From what baseline? To illustrate, let's say the baseline risk of dying from colon cancer (which processed meat is supposed to cause) is 2% so that 2 out of every 100 die from colon cancer over their lifetime (this reference suggests that's roughly the baseline lifetime risk for everyone including those who eat bacon). An 18% increase means your risk is now 2.36% for a 0.36 percentage point increase in risk. I suspect a lot of people that would accept a less-than-half-a-percentage point increase in risk for the pleasure of eating bacon….studies that say that eating X causes a Y% increase in cancer are unhelpful unless I know something about my underlying, baseline probably of cancer is without eating X.”
The real cult of statistical significance (and in effect all of the so called science that follows from it) is a cult like believing and following by multitudes that hear about this study or that, overly dramatized by media headlines, (even if it is a solid study, potentially taken out of context and misinterpreted to fit a given agenda or emotive response), and then synthesized into corporate marketing campaigns and unfortunately public policies. Think gmo labeling, gluten free, antibiotic free, climate change policy, ad naseam.
Showing posts with label statistics. Show all posts
Showing posts with label statistics. Show all posts
Sunday, November 01, 2015
Saturday, April 09, 2011
Text Mining Tweets About Factory Farms
On another blog last year I noted the how those in the agriculture industry were benefiting from the use of social media. (like the Yellow Tail and Pilot Travel incidences). While social media has allowed farmers to organize and communicate about their industry, it also provides a rich data source for measuring sentiment or perceptions about their industry. Companies are finding that by mining text from web pages, comments, blogs, and social media, they can get measure consumer perceptions almost as well or better than they can through explicit surveys. These powerful analytics could be very beneficial to those in the ag industry or agvocacy groups.
After a week as SAS Gobal Forum, I've been pretty excited about some of the text mining presentations that I got to see. After getting home I found a tweet from @imusicmash sharing a post from the Heuristic Andrew blog that shared text mining code from R. (although SAS has some pretty powerful text mining tools, I don’t have access to them for personal blogging purposes) Anyway, I thought I’d take a stab at mining tweets related to ‘factory farms’ using open source R.
I extracted about 2000 tweets containing the term ‘factory farms’ and produced the following cluster analysis on the text:

This seems to give an idea about the content of conversations regarding ‘factory farms.’ Some of these appear to center around gmo foods and Monsanto. This already informs me of misperceptions about ‘factory farms’ and biotechnology. Should people tend to associate these terms when 98% of farms are family farms and most of them raise biotech corn and soybeans?
It seems there are separate clusters of conversations, some related to Monsanto and gmo’s, others related to food and livestock production in general.
It also appears that the topic of ‘factory farms’ is often discussed by the #agchat group, and other food and animal related issues.
I also ran some correlations, or ‘word associations.’ Terms that tend to be used in association with ‘factory farms’ include hens, debeaked,suffering, cruelty,secretive, excess. All of these terms tend to be related to livestock production, and seem to have negative sentment. Words correlated with family farms are more neutral, hauled, Missouri, beans, peas, operated, battling. Terms associated with ‘gmo’ include ban, irreversible, killing. Interesting the term ‘sustainable’ brought up neutral terms. It doesn’t appear, at least from this sample, that sustainable agriculture is associated with biotechnology, at least in the context of tweets related to ‘factory farms.’ Again, to me this speaks more about misperceptions related to modern sustainable agriculture.
Of course, this is just a first jab at this, I’m no expert in text analytics, and I had to rely on my subjective interpretation to some extent. And, obviously, I have not discovered anything that most people in the ag industry don’t already know. However, more sophisticated analysis is possible and could be more revealing than the example I just gave. I truly believe that text analytics can be a powerful tool for the ag industry and agvocation in the future.
Friday, June 04, 2010
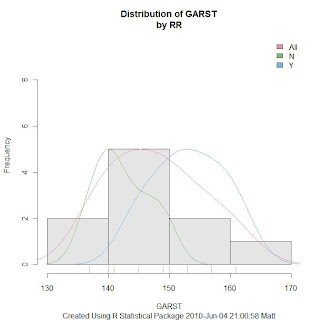
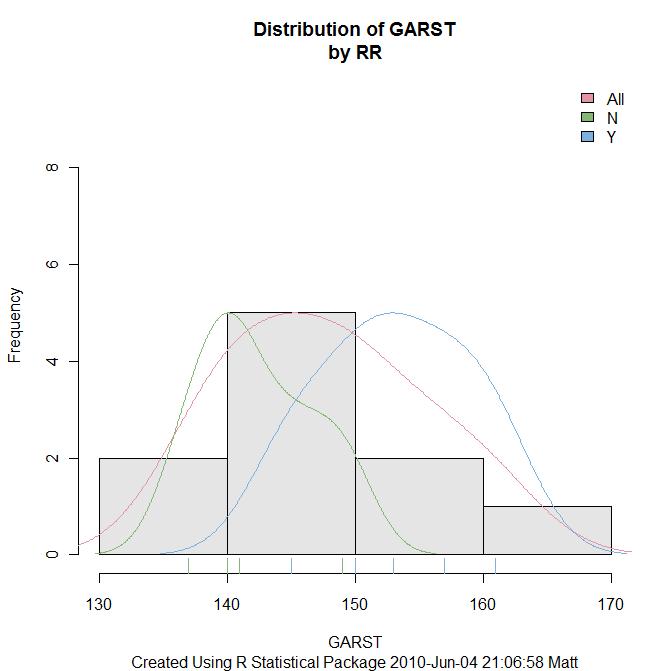
Superimposed Overlapping Kernal Density Plots
Below is a histogram of Garst corn yields (simulated data) and KDE plots for Round Up Ready (RR) non RR and all plots superimposed in one graph. (click to enlarge)
The R package Rattle will do this via the R Data Miner Gui, but I wanted to know how to do it without having to pull up the GUI each time. I thought the code would be more difficult than what it was, but it didn't take me long to figure it out.
When reading the documentation provided by the Data Mining Survivor guide, or one of these sources, I remember authors talking about how useful the Rattle log would be for learning R. I didn't think I'd learn much R this way, but I've been very surprised. For this graphic it was just a matter of copying code from the log and pasting into the R scripting window and making a few changes.
Subscribe to:
Posts (Atom)